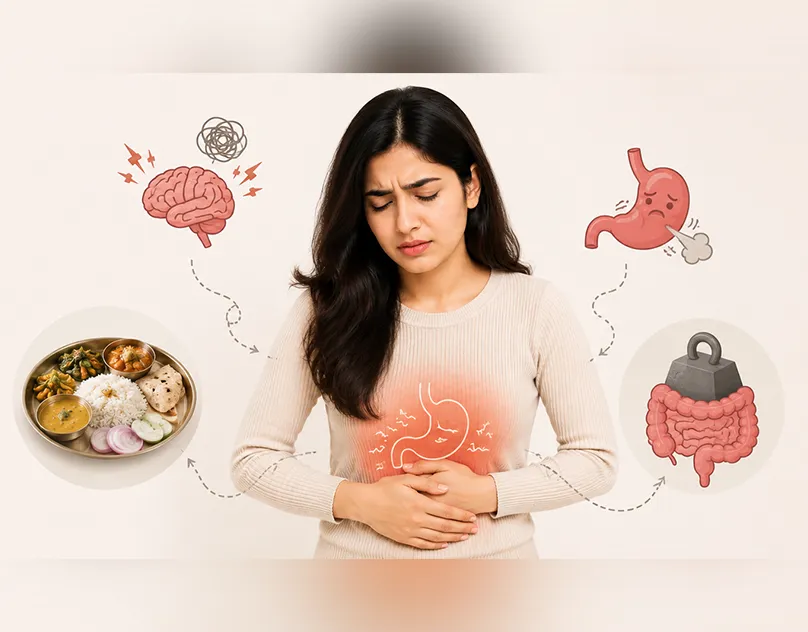
You went in for a routine blood test, or maybe an ultrasound for something unrelated, and the report came back with two words you weren’t expecting: fatty liver. Grade 1, maybe Grade 2. Your doctor probably said the same thing every doctor says: cut down on oil, walk daily, eat healthy, and handed you a printed diet chart that looks exactly like every other fatty liver diet chart you’ll find online.
If your father, mother, or a sibling has also dealt with fatty liver or diabetes, you’ve probably wondered, Is this just what happens to people in my family? Is there something about my body that makes this harder for me than for the next person following the exact same diet?
That question matters more than most diet charts let on. Let’s start with the chart everyone gives you, and then look at why it may or may not be the right one for you.
Before anything else, here is a genuinely useful, doctor-aligned Indian fatty liver diet chart the kind of foundational plan that helps most people. If you take away nothing else from this page, start here.
Foods to Eat More vs Limit / Avoid
| Eat more | Limit / avoid |
|---|---|
| Dal (moong, masoor, chana) and legumes | Maida-based foods (white bread, bakery items) |
| Millets: jowar, bajra, ragi rotis | Deep-fried snacks (samosa, pakora, puri) |
| Leafy greens: palak, methi, sarson | Sugary drinks, packaged juices, sweets |
| Oats, dalia, brown rice (moderate portion) | Excess white rice and refined grains |
| Fatty fish, eggs, skinless chicken | Red meat and processed/cured meats |
| Low-fat curd, buttermilk, paneer | Full-cream dairy, butter, excess ghee |
| Fresh fruits: guava, papaya, apple, berries | Mango, banana, dates in large quantity |
| Nuts and seeds: almonds, walnuts, flaxseed | Coconut, packaged namkeen, chips |
| Filter/black coffee, green tea (unsweetened) | Alcohol, aerated drinks |
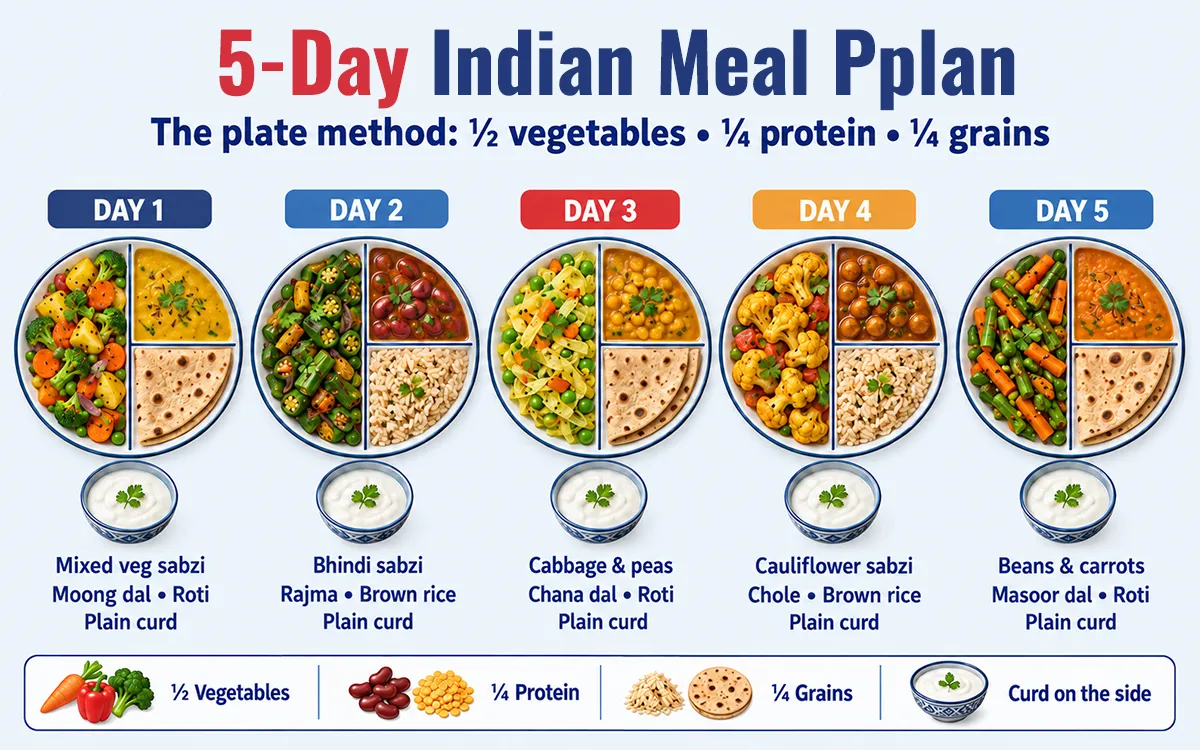
A Sample fatty liver diet chart 5-Day Indian Meal Plan
| Day | Breakfast | Lunch | Evening Snack | Dinner |
|---|---|---|---|---|
| Mon | Vegetable dalia + 5 soaked almonds | 1 bajra roti, moong dal, palak sabzi, salad | Buttermilk with jeera | Moong dal khichdi + cucumber salad |
| Tue | Besan chilla with mint chutney | Brown rice, rajma, lauki sabzi | Roasted chana, green tea | 2 jowar rotis, chicken/paneer curry (low oil) |
| Wed | Oats with chia seeds and skim milk | 2 chapatis, masoor dal, bhindi sabzi | Guava or papaya | Vegetable soup + grilled fish or tofu |
| Thu | Ragi dosa with sambar (low oil) | 1-2 chapatis, chana dal, mixed veg curry | Handful of walnuts, herbal tea | Palak soup + 1 roti + curd |
| Fri | Vegetable poha (minimal oil) | Quinoa, rajma or chole, kachumber salad | Coconut water, roasted makhana | Besan chilla + sautéed vegetables |
This is a solid starting point high fibre, lower refined carbs, controlled oil, liver-friendly proteins. Thousands of people use a version of this chart every day. And yet, dietitians and hepatologists will tell you: some people see their liver fat drop within 8-10 weeks on this kind of plan, and others barely move the needle even after months of strict discipline. Why?
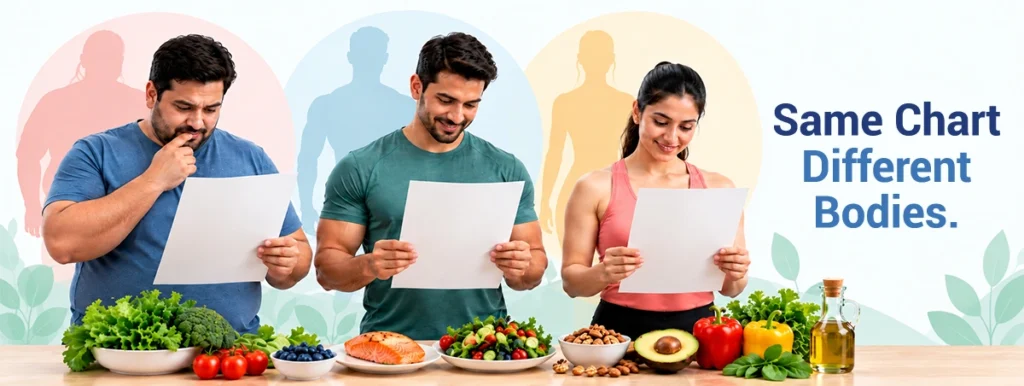
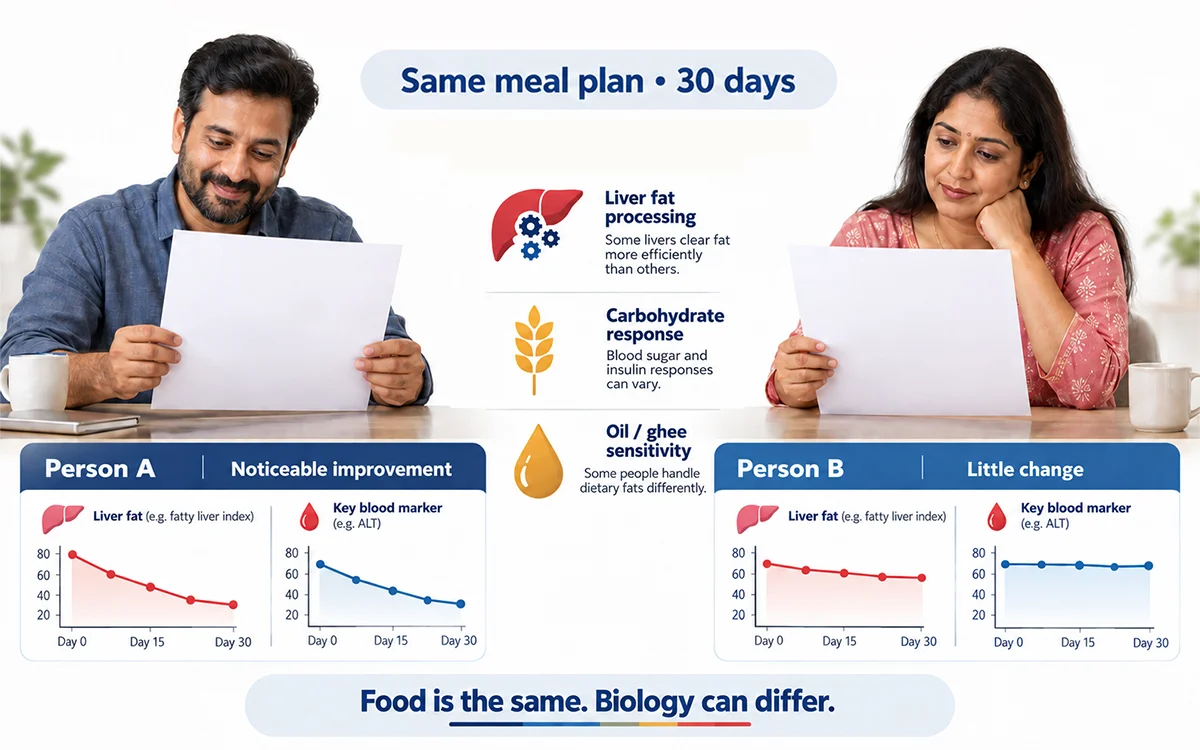
Imagine two people, same age, same city, same fatty liver grade, both put on the exact meal plan above for 30 days. One person’s liver fat and blood markers improve noticeably. The other follows it just as strictly and sees almost no change.
The food didn’t change. What’s different is how each person’s body actually processes fat, sugar, and carbohydrates at a cellular level, how efficiently their liver clears fat, how their body responds to rice or roti, how sensitive they are to oil and ghee. That’s not about willpower. It’s biology, and a large part of that biology is written into your genes.
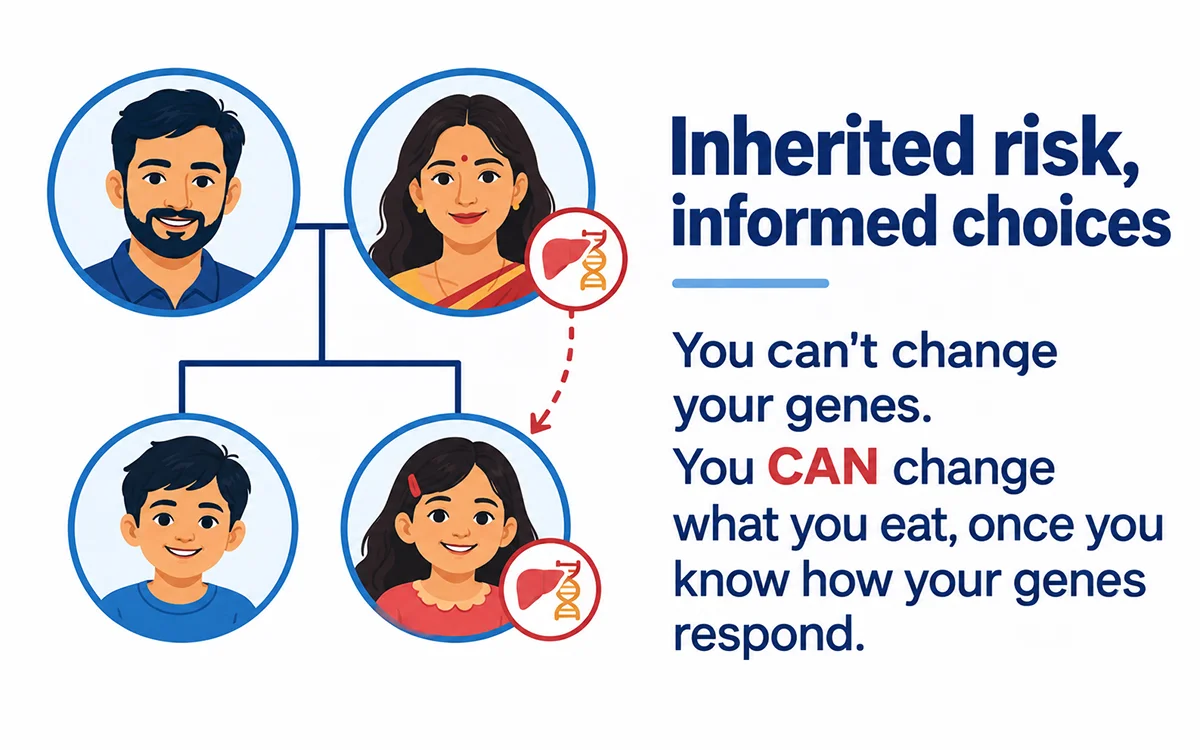
Many Indian families carry a quiet, familiar pattern ” My father also had a fatty liver” or a mother, an uncle, a sibling with the same diagnosis. It’s easy to write this off as “just what happens in our family” or blame it entirely on eating habits.
The truth is more precise, and more useful: specific genes including one called PNPLA3, strongly linked to how the liver stores fat can be passed down from parent to child, along with genes that influence how your body responds to carbohydrates and processed fats. This inherited pattern is a real part of why fatty liver clusters in families.
That’s not bad news. It’s information. You can’t change the genes you inherited, but once you know how they behave, you can finally build a diet around what your body actually needs, instead of what works for the average person.
You shouldn’t have to take “personalized” on faith. Here’s what your report and diet plan actually cover and how each insight translates into real changes on your plate, not just numbers on a page.
Liver Fat Storage Tendency (PNPLA3-linked):
Certain variants in the PNPLA3 gene are associated with a greater tendency to accumulate fat in the liver. If your result indicates increased susceptibility, it gives us another reason to pay close attention to factors that influence liver fat, including overall calorie intake, body weight, added sugars, saturated fat, alcohol and the quality of dietary fats.
This does not mean that everyone with a higher genetic tendency needs an extremely low-fat diet. Instead, the result can help us prioritise liver-friendly dietary changes, such as keeping added fats appropriate for your calorie needs, limiting foods high in saturated fat, and favouring unsaturated fat sources alongside vegetables, whole grains, legumes and other minimally processed foods.
If your genetic susceptibility is lower, it does not mean liver fat is no longer relevant. Your current metabolic health, body composition, blood results, lifestyle and other risk factors still determine what changes are appropriate for you.
Carbohydrate Sensitivity:
This measures how your blood sugar and liver respond to rice, roti, and other carb-heavy staples. A high-sensitivity result usually means your plan will recommend swapping a portion of your daily rice or wheat for millets like jowar, bajra, or ragi, and may set an exact portion guide for example, three-quarters of a cup of rice instead of a full cup, with the difference made up by protein or vegetables. A lower sensitivity result means your carbs can stay closer to a standard Indian plate, with attention placed on quality (whole grain vs refined) rather than strict quantity cuts.
Fat Metabolism Speed:
This shows how efficiently your body breaks down and clears different types of fat. If your metabolism runs slow, your plan will favour lighter cooking methods (steaming, sautéing over deep-frying) and lean protein sources like fish, egg whites, and moong dal over red meat and full-fat dairy. If it runs faster, your plan can allow slightly more healthy fats like nuts, seeds, and fish oil because your body clears them without adding to liver fat.
Your Ideal Grain, Protein & Fat Balance, Rather than a generic “eat balanced meals” instruction, your report converts your genetic profile into an actual daily macro guide for example, a specific gram range for protein per kilogram of your body weight, a recommended grain-to-vegetable ratio per meal, and a daily fat ceiling in teaspoons. This is the number most generic diet charts skip entirely, because it’s different for every person.
Nutrient Absorption & Micronutrient Needs
Some genetic variants affect how well your body absorbs vitamin D, B12, or iron all of which matter for liver and metabolic health. Your report flags if you’re likely to need more of these from food (like eggs, fortified dairy, leafy greens, or safe sun exposure) or if a doctor-guided supplement may help alongside your diet.
Exercise-Nutrition Synergy: Your report also indicates whether your body responds better to daily walking and low-intensity movement, or benefits more from added strength training because pairing the right type of activity with your diet plan speeds up liver fat reduction more than diet alone.
| Insight | What it tells you |
|---|---|
| Liver Fat Storage Tendency (PNPLA3-linked) | Whether your genes predispose you to store more fat in the liver |
| Carbohydrate Sensitivity | How your body responds to rice, roti, and refined carbs |
| Fat Metabolism Speed | Whether oils/ghee should be tightly limited or moderately fine for you |
| Personalized Grain, Protein & Fat Ratio | Exact roti/rice/millet, protein, and daily fat portions suited to your biology |
| Nutrient Absorption Needs | Whether you’re likely low in vitamin D, B12, or iron and need more from food |
| Exercise Response Pattern | Whether walking, strength training, or a mix moves the needle faster for your body |
Put together, this means two people with fatty liver could receive genuinely different plans, one told to sharply cut rice and go easy on oil, another told to focus more on protein timing and add light strength training because the report reflects what their own body needs, not a shared average.
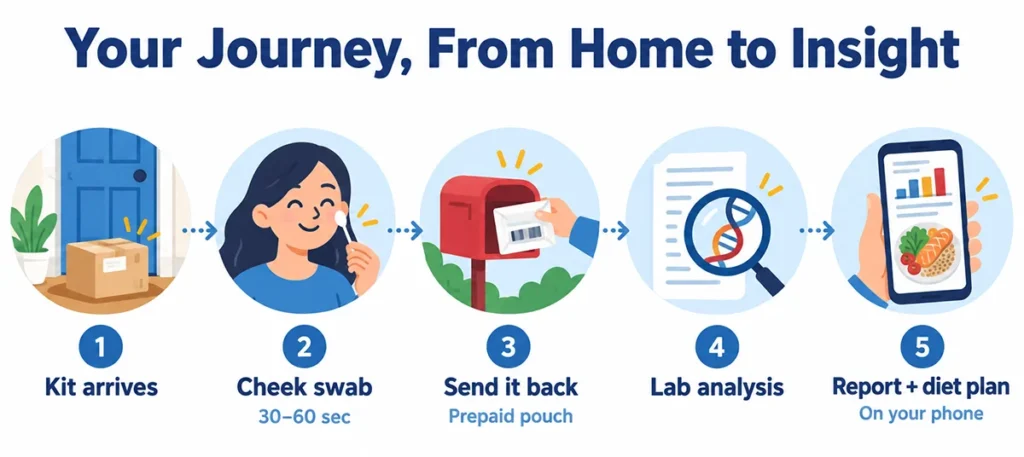
No hospital visit, no needle, no complicated lab process this is one of the simplest tests you’ll ever take, done entirely from home.
- Order your kit online in minutes it arrives at your doorstep in a simple, discreet package.
- Swab the inside of your cheek for 30-60 seconds, just like brushing your teeth no needles, no blood, no pain.
- Seal it in the prepaid pouch provided and send it back, or get it picked up from home.
- Relax while our lab analyzes the genetic markers linked to your liver, metabolism, and nutrition response.
- Get your report and personalized diet plan on the Lifecode app or by email, explained in simple, everyday language.
No fasting, no discomfort, no clinic visit just a two-minute swab today, and a diet plan built for your body within a few weeks. Anyone in your family, at any age, can do it comfortably at home.
Stop Following a Chart Built for Someone Else
You now know why the same fatty liver diet chart can work beautifully for one person and barely help another, exactly what a personalized report tells you about your own body, and just how simple the entire test is to take from home. The only step left is getting started.